
Maritime Carbon
Fleet Emissions Analytics
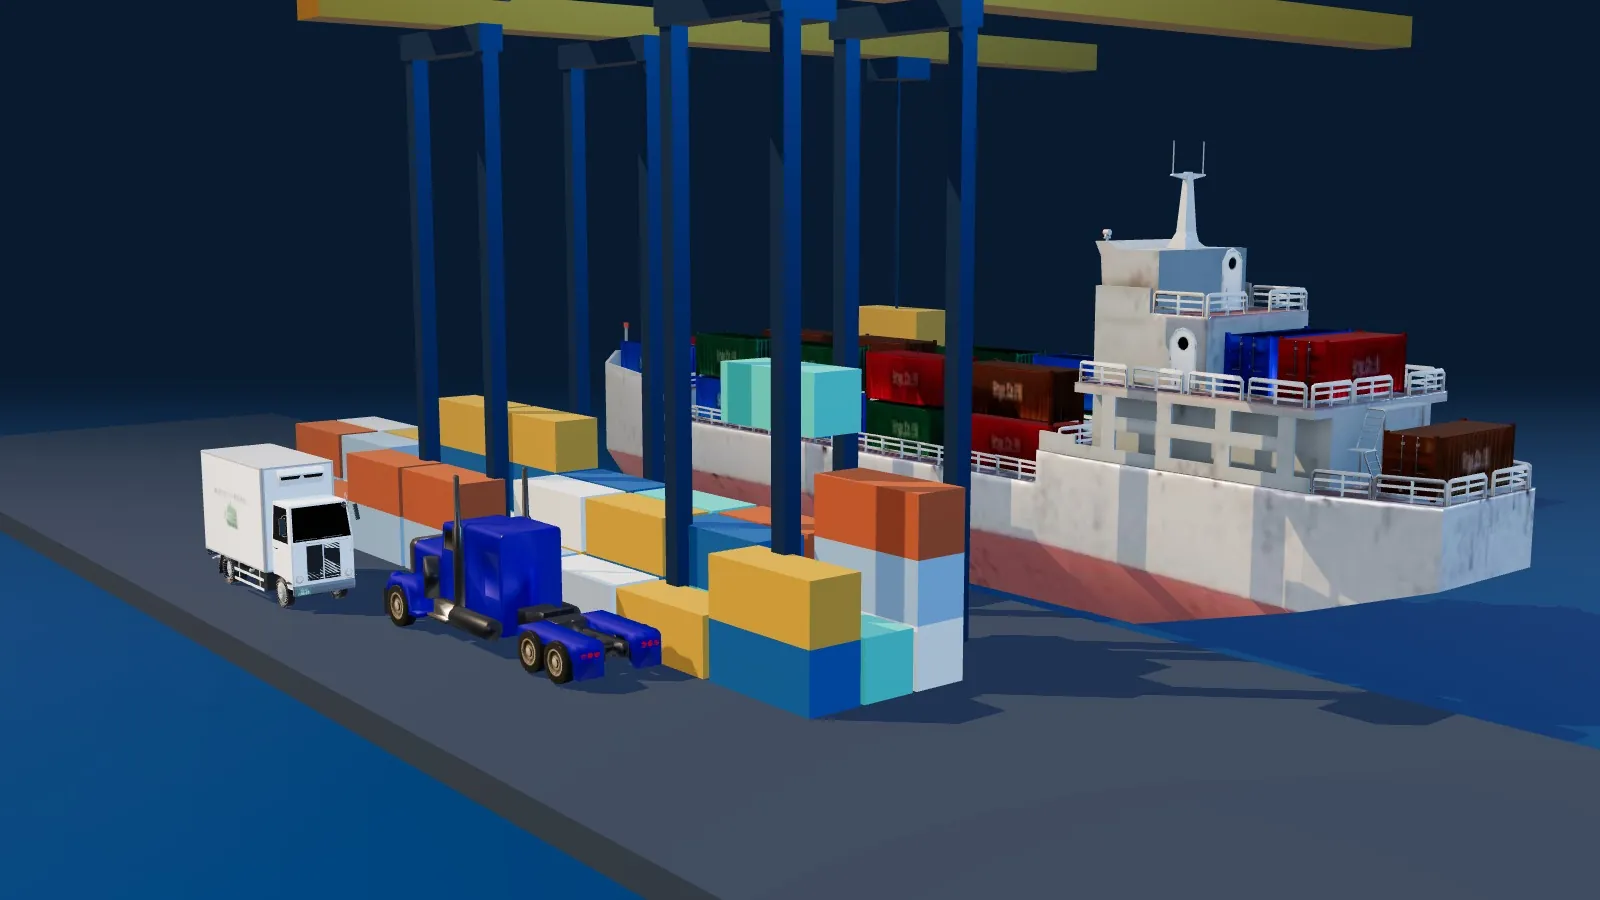
A ship trading into Europe now reports its fuel and emissions for monitoring, surrenders allowances against them, is assessed on the intensity of its energy and is rated on its carbon intensity. In many fleets each of those is assembled by a different team or tool from a slightly different extract of the same reports, and reconciling them takes longer than producing any one of them.
The fix is one dataset at voyage level, built from fuel and position records with every adjustment traceable, from which each regime's figure is derived. For cargo owners the same principle applies from the other side: shipping emissions in a Scope 3 inventory should come from the voyages actually used, not from tonne-kilometres multiplied by a generic factor.
How the work runs
Four phases, and what comes out of each.
2–3 weeks
Trace the fuel from tank to report
We map every source of fuel and voyage data, from bunker delivery notes and noon reports to tank soundings and sensors, and every transformation applied before a figure is reported. Most reconciliation problems become obvious once the lineage is drawn.
Outputs
- Data lineage from source records to each reported figure
- Reconciliation of existing MRV, ETS, FuelEU and CII figures
- Error and gap register with causes
4–5 weeks
Build one voyage-level dataset
Voyages are classified by port pair and time at berth, fuel attributed, and emissions computed once, with each regime's figure derived from the same base. Under the EU ETS that classification matters directly: half of the emissions on voyages between an EU and a non-EU port are covered, and all of those on voyages between EU ports and at berth in EU ports.
Outputs
- Voyage-level emissions dataset with full traceability
- Automated classification by voyage type
- Derived figures per regime from one base
2–3 weeks
Catch errors before the verifier does
Automated checks flag implausible consumption, missing reports and inconsistent bunker quantities as data arrives, so problems are fixed in the month they happen rather than at year end.
Outputs
- Data quality checks running on incoming reports
- Exception workflow with named owners
- Evidence pack structured for verification
2–3 weeks
Serve the cargo owner as well
For cargo owners, shipping emissions are rebuilt for the upstream and downstream transport categories of the Scope 3 inventory on voyage data where carriers provide it, and on documented secondary factors where they do not, labelled clearly. For operators, the same dataset produces per-shipment figures for customers on request.
Outputs
- Scope 3 transport emissions on activity data where available
- Primary and secondary data labelled per lane
- Per-shipment emissions reporting for customers
What good looks like
The ranges we design toward.
1 dataset
Serving four regimes
MRV, EU ETS, FuelEU and CII derived from the same voyage-level base, so they agree by construction.
50% / 100%
EU ETS voyage coverage
Half of emissions on voyages between EU and non-EU ports are covered; all emissions on voyages between EU ports and at berth in EU ports.
5,000 GT
Threshold
The size at and above which cargo and passenger ships fall under the EU ETS and the IMO's CII rating.
Deliverables
What you are left holding.
- 01Data lineage and reconciliation of existing regulatory figures
- 02Single voyage-level emissions dataset with automated voyage classification
- 03Data quality checks and an exception workflow
- 04Evidence pack built for verification
- 05Scope 3 shipping emissions for cargo owners, with data quality stated
What an engagement looks like
A representative shape.
Illustrative. This is the shape of work in maritime carbon, not an account of a specific client. We do not publish named results, and we would be wary of a firm that publishes them without the client in the room.
12 weeks
- 01Situation
A dry bulk operator with part of its fleet trading into Europe had its first EU ETS surrender approaching and no view of its FuelEU balance. Speed instructions were set commercially per voyage, bunkering was decided by price alone, and the CII rating for each ship was discovered after year end.
- 02What we did
Fitted a speed and fuel model for each ship from its own reports, built one emissions dataset serving MRV, ETS, FuelEU and CII from the same fuel records, and priced allowance and FuelEU cost into the voyage evaluation used for fixtures, with a rolling CII forecast per ship.
- 03Where it landed
Carbon cost appeared in the voyage estimate before fixing rather than in the accounts afterwards. Two ships heading for a D rating were identified early enough to act within the year. Allowance purchasing moved from a single deadline purchase to a schedule under a written mandate, and the models were handed to the operator's own team.
Where this connects
Rarely a self-contained problem.
Carbon Accounting
Shipping is often one of the material Scope 3 categories for a goods exporter. The same boundary and evidence discipline applies at sea as on land.
Supply Chain & AnalyticsData Foundations
A dataset that has to reconcile across four regimes and survive verification every year is a data pipeline problem, and needs lineage and testing.
Questions
The ones we get asked.
We already report MRV. What is missing?
Usually nothing in the MRV report itself. What is missing is the link between it and everything else derived from the same fuel. When the ETS figure, the FuelEU balance and the CII rating each come from a different extract, they drift, and every drift is a question from a verifier or a counterparty.
We are a cargo owner, not a shipowner. Is this relevant?
Yes, if shipping is material in your Scope 3 inventory, which for exporters and importers of bulk goods it often is. The improvement is moving from a spend-based or tonne-kilometre estimate to figures based on the voyages your cargo actually travelled on, which is also what customers increasingly ask for.
Do you replace our emissions reporting tool?
Not necessarily. If the tool works, we feed it a cleaner dataset. If it is the source of the disagreement, we will say so. We sell no tool ourselves.
Insights
Related reading.
What CBAM actually asks of an exporter
It is usually described as a carbon tax at the EU border. For a producer it behaves much more like an evidence problem, and the exporters paying most are frequently the ones emitting least.
Pricing supply chain resilience
Every disruption produces a resolution to become more resilient. Almost every resolution dies quietly at the next budget cycle, for a reason that is entirely predictable.
Closely related
More on Maritime Carbon →EU ETS Allowance Strategy
Exposure forecast by ship and voyage, allowances bought on a schedule rather than at the deadline, and the cost passed along the charter chain on purpose.
Maritime CarbonCII & Charter Party
A ship's CII rating forecast before the fixture rather than discovered after the year, and corrective action plans that are costed rather than written to file.
Start a conversation
Talk to us about fleet emissions analytics.
Most useful first conversations are thirty minutes and involve no proposal. Describe the problem you are looking at and we will tell you honestly whether it is one we can help with.
Or write directly to hello@shyenova.com